
A special thank-you to Dr. Kerik Cox for sharing this article in our May newsletter. Because we just didn’t have enough space to run all of his informative graphs, we’re including the remainder here. Refer to your print newsletter to read the text of the article in its entirety.
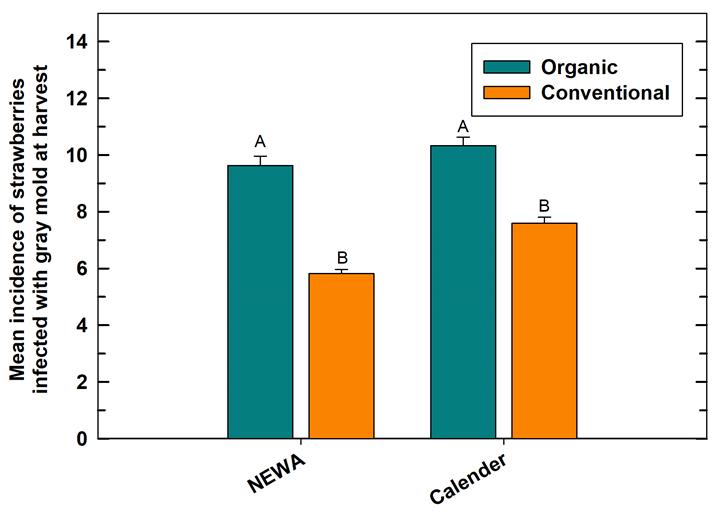
Figure 3. Mean percent incidence of Botrytis fruit rot at harvest in October 2018 in a day-neutral planting of ‘Albion’ strawberries with application timings using ‘NEWA’ or on a ‘Calendar’ schedule for organic (green) and conventional (orange) fungicide programs. Values represent means and standard errors of six plots. Columns denoted by the same letter for plots under “cover” (low tunnels) or “uncovered” are not significantly different (P < 0.05) according to the LSMEANS procedure in SAS 9.4 with an adjustment for Tukey’s HSD to control for family-wise error.
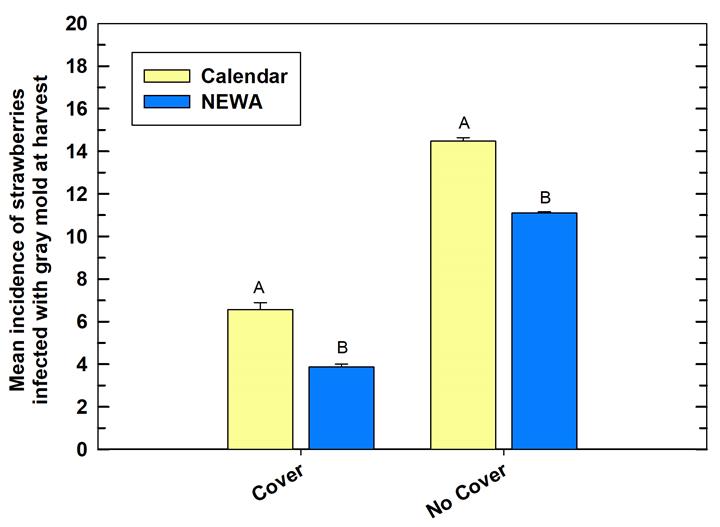
Figure 4. Mean percent incidence of Botrytis fruit rot at harvest in October 2018 in a day-neutral planting of ‘Albion’ strawberries planted on open plastic (cover) or under low tunnels (no cover) for calendar timings (yellow 7-10 days) and NEWA strawberry fruit rot systems (blue “High” risk). Values represent means and standard errors of six plots. Columns denoted by the same letter capital (plots under tunnels) or lowercase (uncovered plots) are not significantly different (P < 0.05) according to the LSMEANS procedure in SAS 9.4 with an adjustment for Tukey’s HSD to control for family-wise error.